

How to Find Slow URLs Using Response Time Checks
Slow URLs can be a sign of overloaded servers, heavy templates, redirect chains, caching problems, rate limiting or network issues. During SEO audits, website migrations and QA checks, response time data helps you spot pages that need closer investigation.
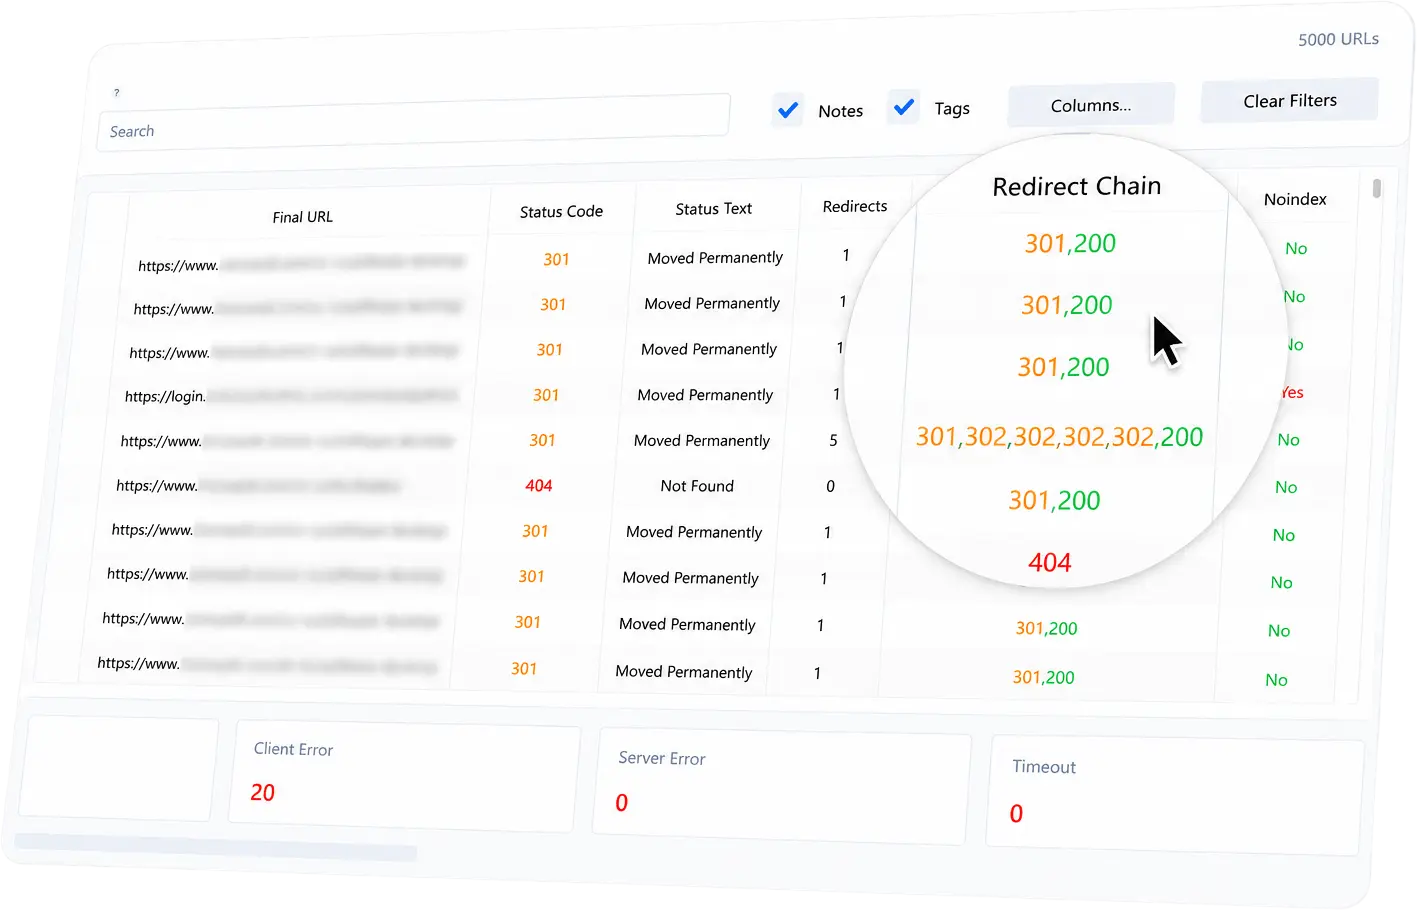
URL Verifier Pro records response time while checking status codes, final URLs, redirects, headers and errors. This makes it useful as a fast bulk URL status checker for finding URLs that are unusually slow compared with the rest of the list.
What response time means
In URL Verifier Pro, response time is the measured time for the HTTP request and response handled by the app. It is not the same as a full browser performance score.
It does not measure:
-
JavaScript execution
-
Image loading
-
CSS rendering
-
Core Web Vitals
-
Visual page load time
It does help you identify URLs where the server response, redirect path, proxy route or network request is slower than expected.
Why response time is useful
Response time checks are useful for finding:
-
Slow pages in a sitemap.
-
Redirect chains that add delay.
-
Server-side errors that appear after long waits.
-
URLs affected by rate limiting or blocking.
-
Slow staging or QA environments.
-
Pages with unusual server behaviour.
-
Groups of URLs that respond slower than the rest of the site.
This is especially helpful when combined with status codes and redirect chains.
Recommended workflow
-
Import or discover the URL list you want to check.
-
Run the scan with sensible timeout and concurrency settings.
-
Sort the results by Response Time.
-
Filter out Failed, Timeout, 4xx and 5xx rows so you can review them separately.
-
Review slow
200pages and slow redirects. -
Compare response time with redirect count and redirect chain.
-
Add notes or tags for slow URLs that need follow-up.
-
Export a focused CSV report.
What to look for
Slow successful URLs
A slow 200 OK page may indicate server load, caching issues, database delays, heavy backend processing or regional network latency.
Slow redirects
Redirect chains can add extra time before the final page is reached. If slow URLs also have multiple redirect hops, review whether those redirects can be simplified.
Slow errors
A 404, 500 or timeout after a long delay may point to server configuration, routing or application issues.
Slow groups of URLs
If an entire folder, template or section is slower than the rest of the site, tag those rows together and investigate them as a group.
Useful columns for slow URL reports
A response time report should usually include:
-
Original URL
-
Final URL
-
Status code
-
Status text
-
Redirect count
-
Redirect chain
-
Response time
-
Content type
-
Server header
-
Cache-Control header
-
Error details
-
Notes
-
Tags
Settings that affect response time
Response times can be influenced by:
-
Overall concurrency
-
Per-host concurrency
-
Request timeout
-
Redirect limit
-
Request delay
-
Random jitter
-
Retry behaviour
-
Backoff after
403or429 -
Proxy settings
-
Network conditions
-
Server load
For fragile or rate-limited sites, use lower concurrency, add delay and increase backoff so the scan is less aggressive.
How to report slow URLs
Do not treat response time as a final performance diagnosis. Use it as a triage signal.
A good report separates:
-
Slow successful URLs
-
Slow redirect chains
-
Timeouts
-
Server errors
-
Proxy-related delays
-
Blocked or rate-limited responses
Use tags such as slow, slow redirect, timeout, server review, cache review or retry later to keep follow-up organised.
Final check
After changes are made, rescan the same URL set with the same settings. This gives you a cleaner before-and-after comparison and helps confirm whether server, caching or redirect fixes improved the results.